|
Moving Averages
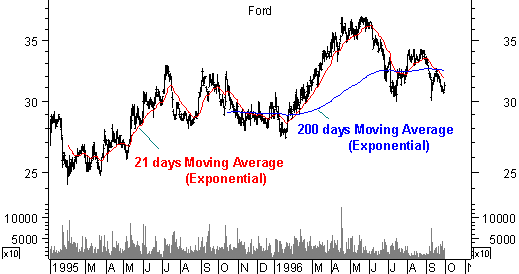
A moving average is the
average price of a future/commodity over the previous period closes.
Moving Average Price
Signals
A. When price rises
above the moving average , this is a bullish indication. When the price falls
below, this is a bearish indication.
B. When a short term
moving average crosses above a longer term moving average , this indicates
an upswing in the market.
C. When a moving
average crosses below a longer term moving average this indicates a down turn in
the market.
Trading Signals
- Signals are generated
when price crosses the moving average.
- Long signals are
generated when price crosses above the moving average from below.
- Short signals are
generated when price crosses below the moving average from above.
The most popular method of interpreting a moving average is
to compare the relationship between a moving average of the security's closing
price and the security's closing price itself. A sell signal is generated when
the security's price falls below its moving average and a buy signal is
generated when the security's price rises above its moving average. This type of
moving average trading system is not intended to get you in at the exact bottom
and out at the exact top. Rather, it is designed to keep you in line with the
security's price trend by buying shortly after the security's price bottoms and
selling shortly after it tops.
The critical element in a moving average is the number of time periods used
in calculating the average. When using hindsight, you can always find a moving
average that would have been profitable. The key is to find a moving average
that will be consistently profitable. The most popular moving average is the
39-week (or 200-day) moving average. This moving average has a good track
record in timing the major (long- term) market cycles. The length of a moving
average should fit the market cycle you wish to follow:


|